Summary:
I conducted two in-depth projects using the Google Merchandise Store GA demo account to practice advanced reporting and data analysis. These projects assessed campaign performance and focused on three key areas: Audience, Marketing, and Sales.
I used advanced Google Analytics displays, segmented data by characteristics, geography, and user behavior, and created remarketing insights across Audience, Acquisition, Conversion, and Behavior reports.
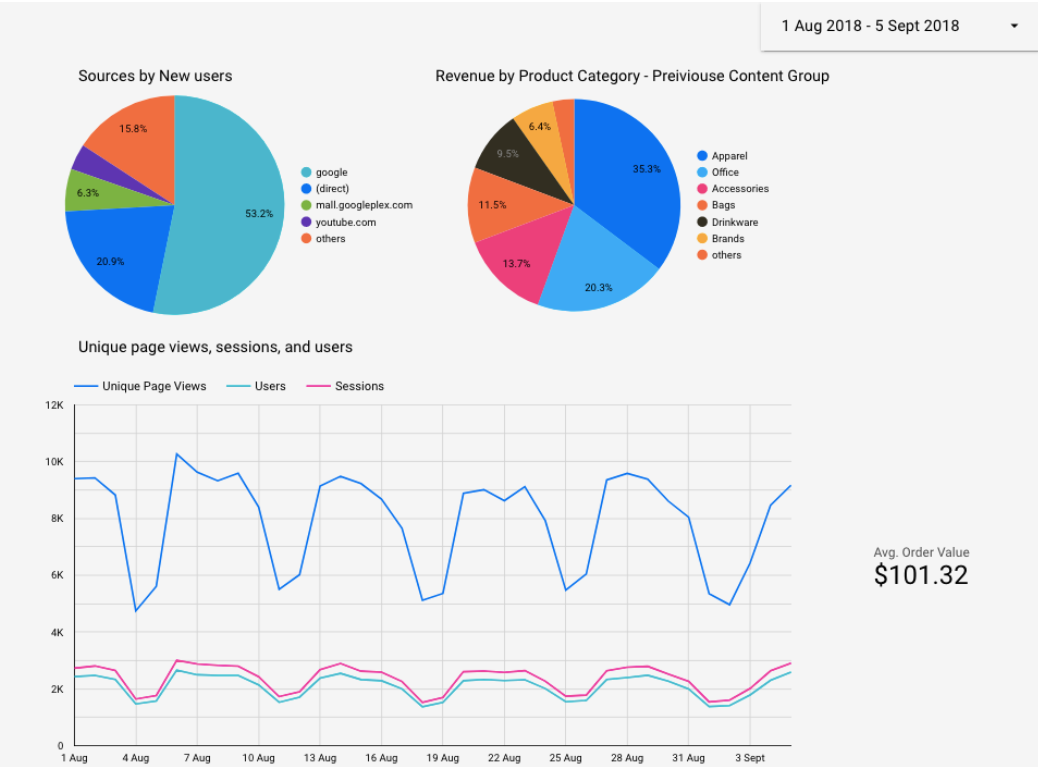
To visualize insights effectively, I integrated Google Analytics with Looker Studio, building a dynamic dashboard that adjusts across different date ranges.
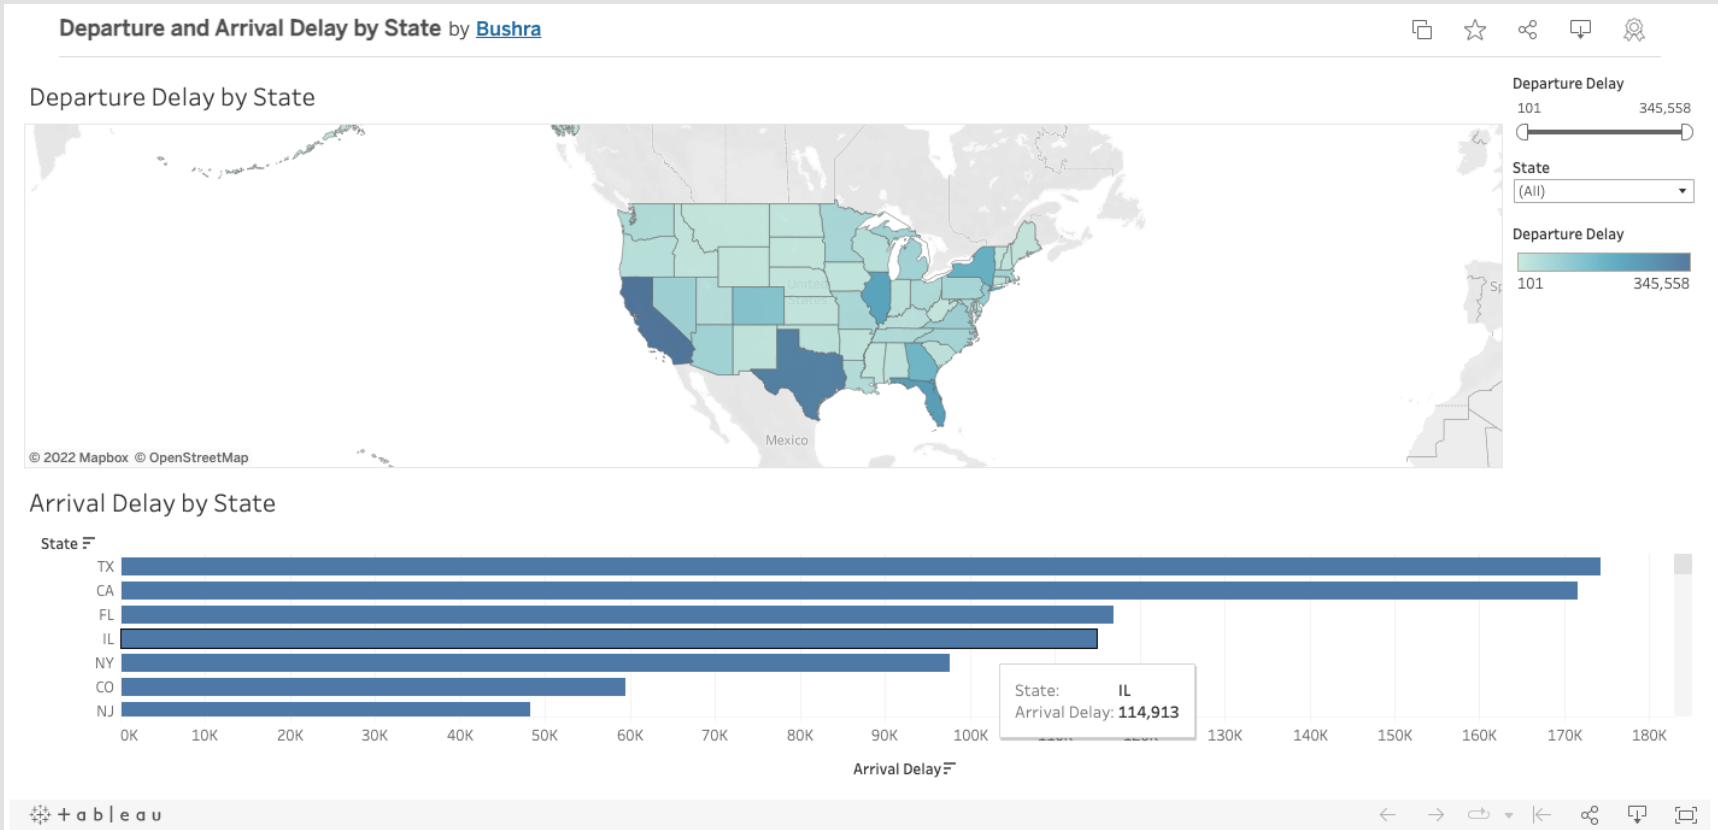
For more interactive data work, I used Tableau to design dashboards for U.S. flight delay data—visualizing patterns with bar charts, line graphs, maps, and filters.
Data Visulization
To visualize insights effectively, I integrated Google Analytics with Looker Studio, building a dynamic dashboard that adjusts across different date ranges.
For more interactive data work, I used Tableau to design dashboards for U.S. flight delay data—visualizing patterns with bar charts, line graphs, maps, and filters.